A/B testing is one of the most polarizing marketing tactics ever invented. It seems like everyone has an opinion on whether it works or not.
So, where do I stand on the issue?
Well, if you do it wrong, I think it is a giant waste of your time. But if you do it right, A/B testing can make a major impact on your conversions.
Only 28% of marketers are satisfied with their conversion rates. That’s a sad statistic.
The good news is that A/B testing is an easy way to improve those conversion rates if you know how to do it effectively.
But the problem is that many marketers aren’t sure how long they should run their A/B tests for or even how to set them up to ensure accurate results.
Thankfully, you don’t have the blaze the trail. Many have already benefited from A/B testing, and we can learn from their success. Plus, there are tools available do much of the hard work for you.
I’m going to show you how long you should run your A/B test for and give you a few simple rules that will help you get accurate results every time.
Does A/B testing really boost conversion rates?
Let’s start at the beginning. What are A/B tests, anyway?
An A/B test is simply a way to compare two variations of the same concept to see which performs better.
Here’s an example of a simple A/B test from Optimizely.
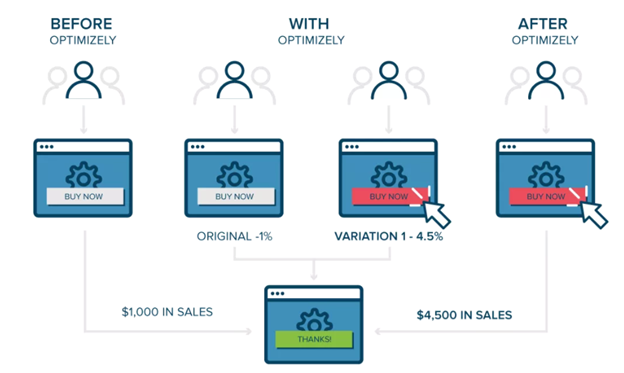
A/B tests let you ask the right questions about specific changes to your site, your app, or any other content source you’d like to improve.
More importantly, it allows your audience to provide the answers.
It isn’t a new concept, either. In fact, A/B testing has actually been around for almost 100 years.
It got its start in agriculture with farmers attempting to test how much fertilizer to use on their fields. Then, it made its way into medicine in the form of clinical trials.
So, what’s the benefit for you?
For one thing, A/B testing provides data to support a hypothesis so that you aren’t acting on a wild guess.
I doubt that your finance department is very fond of wild guesses when it comes to setting and meeting budgets. You shouldn’t be, either.
Look at this example of how conversions improved by 11.5% for Kiva.org by simply adding FAQs, a few statistics, and some social proof.
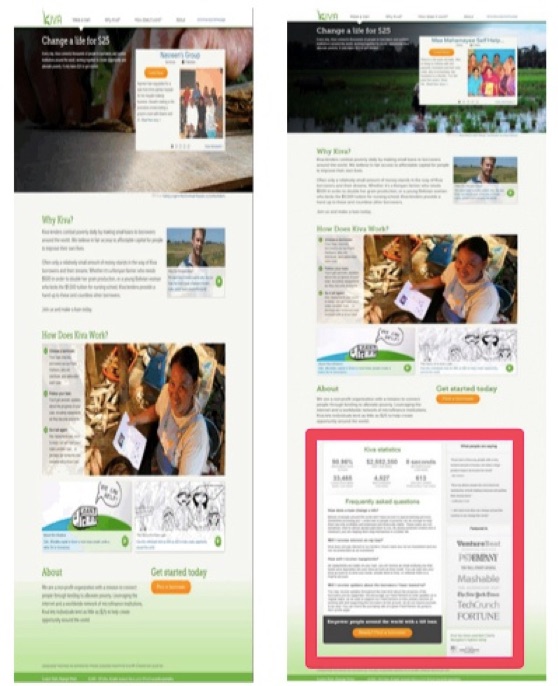
That’s a healthy return on a small investment of effort.
Even President Obama’s campaign used A/B testing. His team split tested their campaign website, they were able to collect 2.8 million more email addresses.
That translates into a lot of campaign funding (to the tune of $60 million). And when Election Day was finally over, their campaign yielded great success.
So, if it works, then why don’t more marketers do it?
In many cases, marketers simply don’t make it a priority.
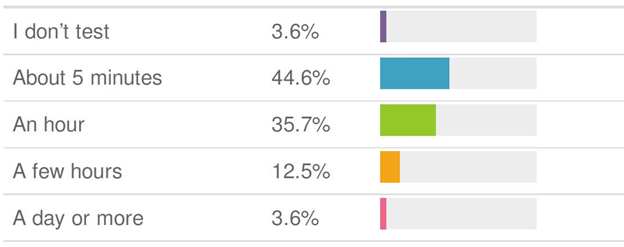
Despite the fact that websites see an average lift in responses of 13.2% from A/B split testing, 61% of marketers do not test subject lines. Of the ones who do, 74% spend less than an hour on their subject line tests.
They wrongly assume that a change will only provide insignificant results because they aren’t measuring the right things to begin with.
In reality, studies show that A/B testing creates up to 40% more leads for B2B sites and 25% more leads for e-commerce sites.
But there’s also a good reason that some businesses don’t A/B test: they know that they aren’t ready to do it.
The reality is that some businesses simply aren’t yet at a place where A/B testing would be helpful. So, how can you determine whether you’re ready or not?
If your conversion volume is less than 1,000 per month, you aren’t ready. Your results will not be statistically significant.
Wait until your conversions ramp up over 1,000, and then you can start A/B testing with confidence that your results will mean something.
We’ll dive into that later on in this article.
If you’ve been testing for a while, but you don’t feel like you’re getting a good return on your efforts, take a look at the main reasons why A/B tests fail:
- You’re starting with the wrong hypothesis.
- You aren’t taking statistical significance into consideration.
- There aren’t enough conversions in the experiment to make it valid.
- You aren’t running the test long enough.
Here’s how to stop these four saboteurs to make sure your A/B tests aren’t a waste of time.
Do your research
Before you do anything else, you need to decide what to test.
Every good experiment begins with an educated hypothesis. A/B tests are no different.
Unfortunately, many site owners run their test on “gut feelings” instead of on data and thoughtful hypotheses.
This pie chart from 2014 shows the ways that e-commerce companies were choosing to implement new changes.
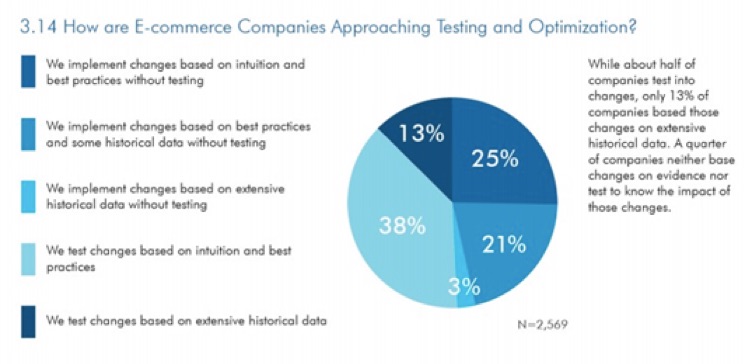
There is simply no excuse for this anymore. As you’ll see throughout the rest of this post, case studies have proven the power of A/B testing.
It’s up to you to run accurate tests and implement changes based on the data.
First, you have to take a look at what isn’t going right for your company. Is it a lack of conversions? Are you lacking new email sign-ups?
Now, translate that shortfall into an achievable goal. Make it specific and measurable.
Next, take a look at your buyer personas. If you haven’t looked at them in a while, it’s time to get them out and dust them off.
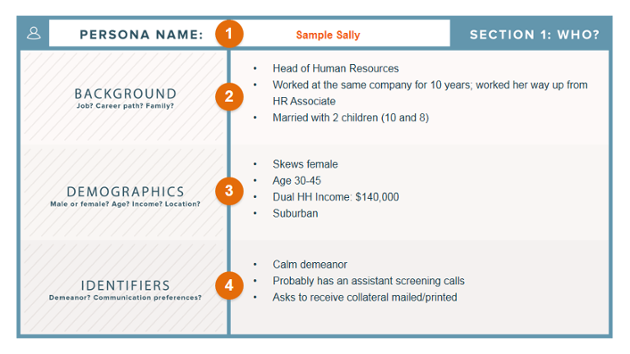
If you haven’t created buyer personas yet, don’t panic.
HubSpot offers a simple template to help you get started with your persona library.
Using the information you know about your audience, take a long, hard look at how you’re letting them down when it comes to customer experience.
It’s not easy to go on a faultfinding mission with the content you’ve worked so hard to create, but this step is very important.
Try running a 5-second test with a portion of your audience to shine a light on problem areas.
Once you have a better idea of how you can improve, it’s time to write your hypothesis.
Narrow your focus to something that you can realistically change and resist the temptation to ask leading questions. Wishpond recommends using these three steps:
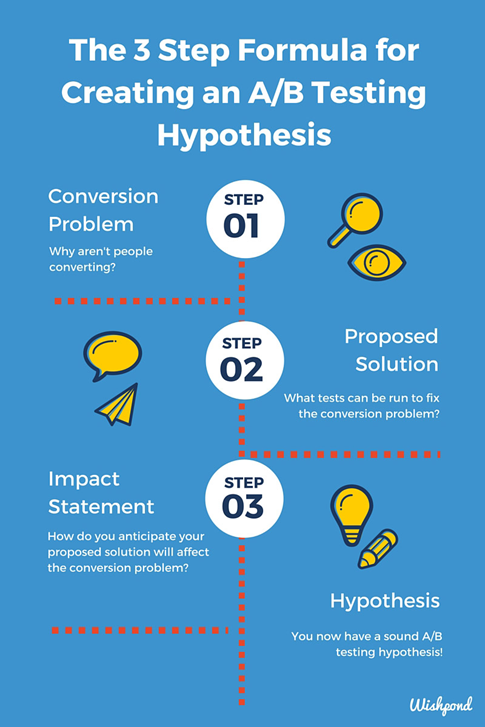
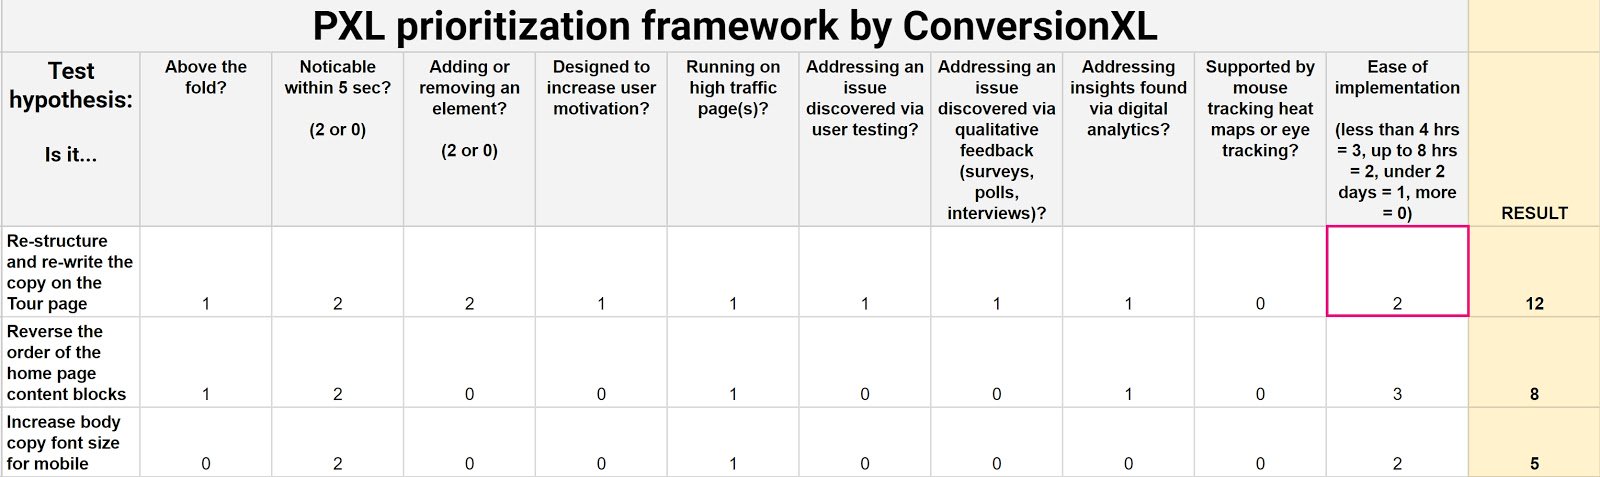
Maybe forming a hypothesis isn’t your issue. Maybe it’s narrowing your focus to the highest-priority issues so you know what to test first.
Conversion XL has a great prioritization worksheet to help you decide where to focus your energy first.
Now that you have your hypothesis, it’s time to put it to the test.
Statistical significance is key
Statistical significance reflects the level of risk involved with the variation you are measuring.
It’s your level of confidence in the outcome that you select.
According to Optimizely, “statistical significance is a way of mathematically proving that a certain statistic is reliable. When you make decisions based on the results of experiments that you’re running, you will want to make sure a relationship actually exists.”
For meaningful results from meaningful data relationships, don’t stop running your test until you reach a statistical significance of 95%-99%, which simply means that you are 95%-99% confident that your outcome is valid.
Look at this example from ConversionXL.
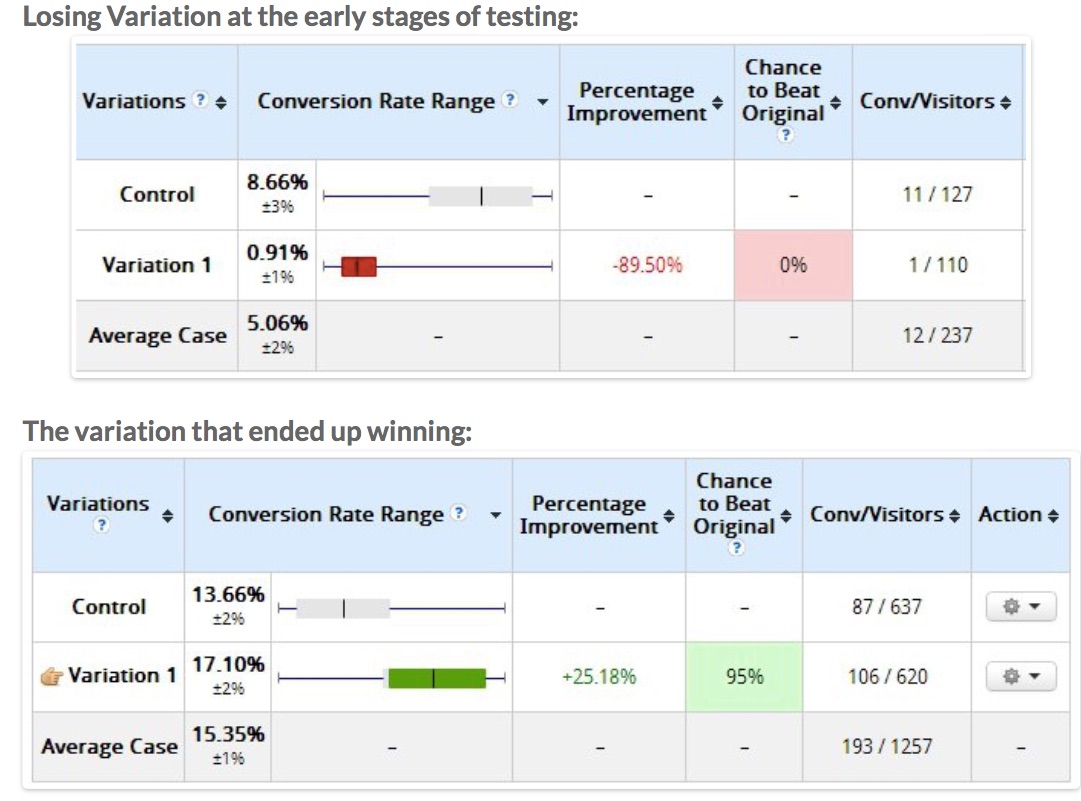
As you can see from the data, Variation 1 seemed like a losing proposition at the outset. But by waiting for statistical significance of 95%, the outcome was totally different. In the end, Variation 1 won out by over 25%.
If they had cut off the test early, they would have skewed the results, and the test would have been pointless.
Here’s another example from BaseKit, an online website building company.
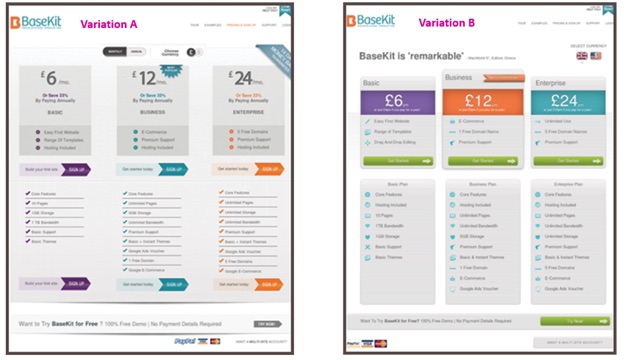
Since most of their traffic is paid, they could safely assume that their audience had a distinct interest in their product. It makes sense, then, that they focused their test on their pricing page.
They reached statistical significance of 95% within 24 hours and saw an overall conversion boost of 25% just by redesigning their pricing page.
Tools like this one take the hard work out of determining statistical significance.
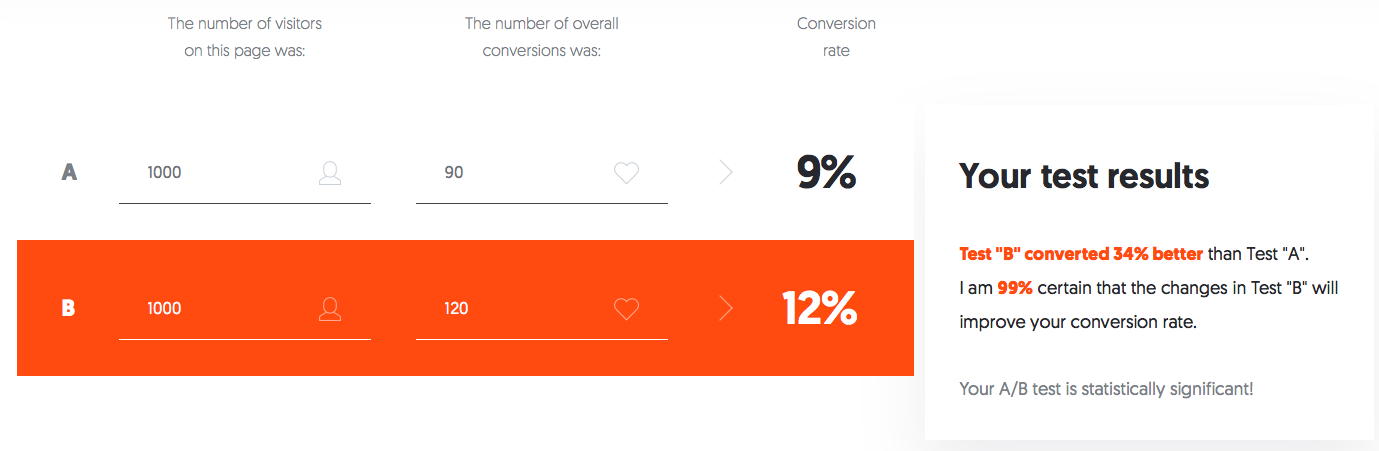
If at some point you want to run more than just a split test (comparing only two variables), this tool will allow you to add as many variations as you’d like to analyze significance on each of them.
Simply enter the number of visitors and the number of overall conversions of your variants, and the tool compares the two conversion rates and tells you if your test is statistically significant.
If your significance is not 95% or higher, then keep testing.
I can’t stress this enough: don’t quit once you reach what you think is an adequate level of statistical significance. Never stop before you reach 95%, and aim for statistical significance of 99%.
Anything else is a wild guess.
Reaching statistical significance isn’t the only ingredient for a successful A/B test. Your sample size also makes a huge difference on the results.
Size matters
If your sample size or conversion pool is too small, your margin of error will increase.
That makes sense, right?
Think of it this way. Let’s say that I have a bag of 100 jellybeans, and I want to run a test to see the likelihood of pulling different flavors out of the bag.
So, let’s say that I randomly pull three jellybeans out of the bag, and all three of them are licorice-flavored. If I only use those three jellybeans to gauge my likelihood of pulling out another licorice jellybean, I’m unlikely to get an accurate result from my test.
It’s possible that there are only four or five licorice jellybeans in the entire bag, and I just happened to pick three of them right away. Or perhaps half of them are licorice and the other half is a cherry.
Whatever the case may be, if I only use those three jellybeans to determine my odds of drawing more licorice ones, I’ll assume that my odds are far higher than they actually are.
Or, if I only pull out three jellybeans and none of them are licorice, I may wrongly assume that I’ll never pull a licorice jellybean from the bag.
Those are two different assumptions, but both are wrong because the sample size of the test was too small to draw sound conclusions from.
So what is that magic number of conversions or subjects you’ll need for your test?
Obviously, it varies a bit depending on your overall number of visits and conversions. But, a solid guide is to have at least 1,000 subjects (or conversions, customers, visitors, etc.) in your experiment for the test to overcome sample pollution and work correctly.
Some marketing experts even recommend sample sizes of up to 5,000 people.
Remember that if you’re running an A/B test (two variants), you automatically split that sample in half and show one variant to each half. When you think of it that way, you wouldn’t want to drop below 500 samples, right?
Another consideration that you can easily overlook in A/B testing is making sure that your sample audience actually represents everyone in your conversion universe. If you aren’t careful, you could receive inaccurate results due to sample pollution.
Here’s a common example of sample pollution:
Many of your visitors access content on their desktops, tablets, laptops, and even televisions.
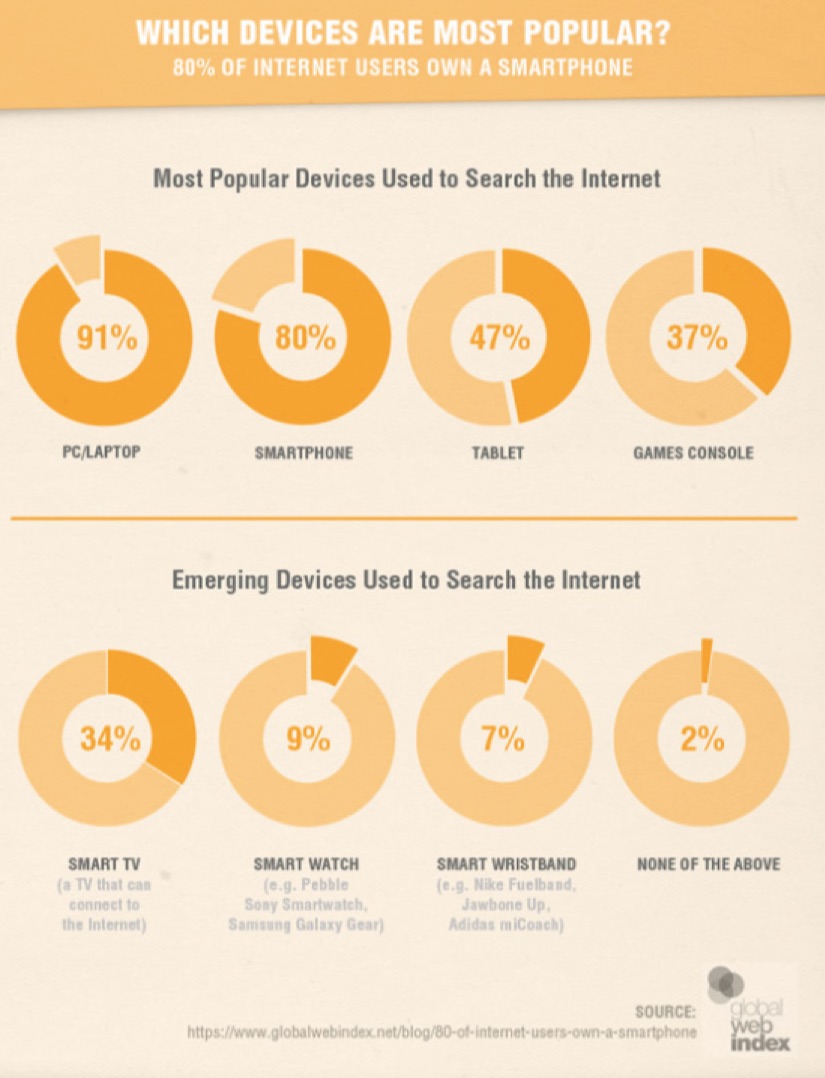
They are accessing your website and content from a bunch of different devices.
If you include each of those visits in your data (as if they are a unique visitor), you’re a victim of device pollution. You’ve essentially counted the same visitor
source https://blog.kissmetrics.com/how-long-to-run-an-ab-test/
No comments:
Post a Comment