It’s true. Your customers don’t care about your product. Don’t worry, they don’t care about your competitor’s products either. Your customers don’t care about any products. Thankfully, your customers do care about something, which is why they buy your product.
Your customers care about the progress they will make as a result of using your product.
As Growth Marketers and Product Builders, it’s our job to make sure customers understand how our product will change them for the better. Then we can create an efficient customer funnel that turns potential customers into loyal, repeat customers. We use data to optimize each stage of the user lifecycle. However, it’s easy to get bogged down in user data and product features. When we lose sight of whether or not our customers have realized the better life we’ve promised, the customer becomes stuck in our funnel and we lose our customer.
By understanding the progress our customers are hoping to make, we can increase conversions at any stage of the user lifecycle: Acquisition, Activation, Retention, Revenue, and Referral.
Customers Buy Progress
Customers actually don’t buy your product. They aspire to be more awesome, and they believe your product will help them get there. They buy the vision of themselves being more awesome. This visual from Samuel Hulick explains why customers buy products.
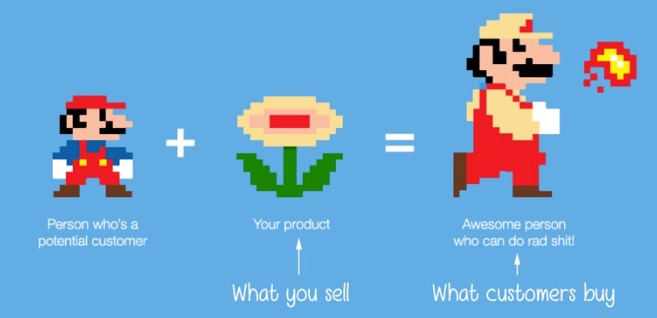
Customer progress is a key concept of Jobs To Be Done (JTBD). I was first introduced to the above Super Mario graphic by Alan Klement’s book on JTBD, When Coffee & Kale Compete. The JTBD helps us focus on the customer’s desire to make life better and the progress they are hoping to achieve. With this focus, we can grow faster and build better products.
Alan lists 10 JTBD principles in his book. We’ll focus on two.
- Customers don’t want your product or what it does; they want help making their lives better.
- Solutions and Jobs should be thought of as parts of system that work together to deliver progress to customers.
The rest of this article will show how growth and product teams at B2B and B2C orgs have used these two principles to create better top of funnel marketing messages and increase LTV and retention through progress-centric product updates.
Acquisition
- Create ads and content that focus on progress. Progress is overcoming an emotional struggle to make one’s life better.
- Make sure you have the right understanding of progress for your audience.
Case Study
TownHound was a dual-sided marketplace that was picked up by Google just 8 months after launch. It was a mobile app that brought restaurants more patrons during off-peak hours by offering discounts to its users. In just 3 months, TownHound was able to sign on 6x more restaurant partners in the San Jose, CA region than it’s behemoth competitor Groupon.
This is a huge accomplishment because two-sided marketplaces are tricky. You need a high volume of Demand (customers redeeming TownHound deals) in order to build up Supply (restaurant partners that offer deals). Bryan Solar, Co-Founder of TownHound, understood the progress that his customers were hoping to achieve, which he used to guide his paid acquisition strategy.
Early on, his Facebook and Instagram ads were just doing okay. TownHound was bringing on new users, but they weren’t sticky. Users would download the app, redeem a single deal, and then poof, they were gone. He wasn’t acquiring the right users.
He needed more quality users in order to satisfy the balance of his two-sided marketplace. He decided to interview customers that had redeemed more than one deal.
Bryan’s interviews led to a huge discovery. He learned that his best users were dating app users. His repeat customers were using TownHound while on first, second, or third dates.
- TownHound’s Restaurant partners want more patrons during slow hours: Monday – Thursday nights.
- Dating app users typically meet for dinner during the week because weekends are too precious to waste on a potentially traumatic first Tinder date experience.
- It’s a match!
Bryan learned that his best customers didn’t use TownHound to get discounts on meals. They use TownHound in order to find the right person for a relationship. He also understood that his customers didn’t necessarily love to go on dates. Dates are exciting, but they’re also stressful and expensive. For many, dates are a necessary evil.
When TownHound’s ad content changed, quality user growth and restaurant partner growth rapidly increased.
- Before: Ads focused on saving money on dinner.
- After: Ads focused on relieving the pain of going on expensive dates.
Bryan found his core audience and tailored acquisition efforts to focus on their progress, rather than the function of his product.
Activation
- Re-highlight the progress that was promised in acquisition.
- Link onboarding process to progress or overcoming a struggling moment.
Samuel Hulick, the creator of the Super Mario graphic above, runs UserOnboard.com – a site dedicated to onboarding and activating users. He sat down with Ryan Singer of Basecamp and discussed how JTBD can be applied to the onboarding process. Ryan noticed a change in the way he approaches onboarding when customer progress is his goal.
“That’s really interesting to look through a Jobs-to-Be-Done lens, because then the question becomes ‘what can we do to help this person decide that this is the right tool for them?’ That’s a very different task for the designer than ‘how can I thoroughly explain the mechanisms of my products?’”
Case Study
Le Tote is an e-commerce subscription service for women that delivers a personalized box of clothes directly to their customer’s doorstep. Le Tote’s monthly subscription lets customers wear the clothes they receive as long as they want, and then receive a new box in exchange for sending back their previously worn garments. Le Tote is old-school Netflix for women’s clothes.
Le Tote uses style preferences, ratings of previously shipped garments, and sizing info to curate a box of clothes for each customer. In theory, the more you use Le Tote, the better the service is at matching you with clothes you’ll love.
However, Le Tote doesn’t have a history of customer feedback to leverage when shipping a box to a first time user. It’s critical that Le Tote gets the first box right because it’s essentially a “test drive.” Send a bad box to a first time user and the likelihood of them sticking around for a second box is slim.
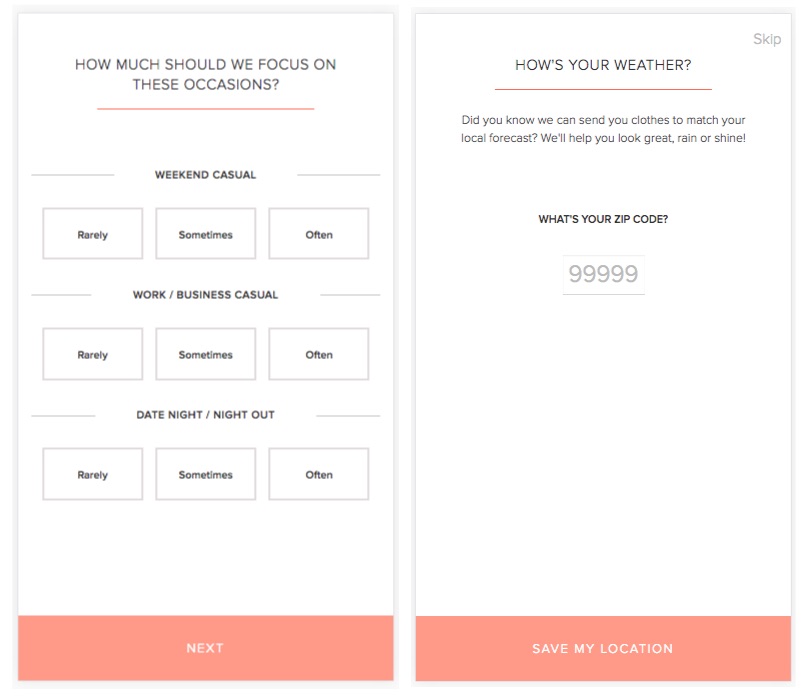
If the first box is critical to a new user adopting Le Tote, then the onboarding process incredibly important. Le Tote needs to gather as much info about their customer’s style preferences during onboarding as possible in order to make a great first impression, without bombarding users with tedious onboarding tasks. So how does Le Tote get users through a lengthy onboarding process without seeing a drop in conversion?
Here are two steps in the process. The user is met with easy to answer questions about occasions that are hard to dress for and weather, which is uncontrollable.
Now, think about the progress that Le Tote’s customers are hoping to achieve. They want access to new, trendy clothes in order to feel confident in situations that matter. Buying a new garment from a traditional e-commerce site for every special occasion can get expensive. Plus, ‘that perfect new shirt’ tends to lose it’s magic after a few wears and a couple months in the closet. A Le Tote customer wants to feel confident in new clothes while maintaining wallet-friendly peace of mind.
Le Tote communicates progress by highlighting a few occasions that customers have struggled to get ready for in the past. This reminds the user why she’s jumping through onboarding hoops — to overcome these struggling moments and make progress. This is easily forgotten when onboarding focuses too much on the product and not the user, and we activate fewer users as a result.
Retention
- Use data to track changes in usage behavior.
- Interview customers when behaviors change to understand if customers are making progress.
- Make product changes when features are standing in the way of progress.
Your marketing and sales efforts have promised the solution to a struggling moment, and your customer has chosen your product to take them from ‘Normal Mario’ to ‘Awesome Fireball Throwing Mario’.
If you don’t deliver progress, your customers will churn. How do we know that we’re delivering progress?
Behavioral data helps us understand which features are being used and how often customers are coming back. This data is incredibly actionable, but it doesn’t tell us if our customers are actually making progress.
Customer interviews are key to improving retention. Data will help uncover behavior changes of our customers, but interviews will reveal the why behind those changes. Alan Klement gives us examples of behavior changes to investigate through customer interviews: “When someone purchases a product, begins to use a new product, stops using a product, suddenly uses a product more, and suddenly uses a product less.” (p. 190).
Case Study
Wade Warren, Co-Founder of Resource, is using JTBD to guide the product roadmap of his candidate sourcing platform. Resource finds candidates and then writes personalized, custom outreach that comes from an internal recruiter’s identity. It’s a platform that helps recruiters with limited hiring bandwidth to build teams faster.
Resource has a feature where new candidates are automatically screened in – which means that they are contacted without explicit recruiter approval.
Wade noticed a decline in usage in the product. People were signing up for Resource, adding a number of roles and using it for a few weeks, before suddenly pausing their roles and stopping usage. His team interviewed customers to understand the root of the issue. One of his interviewees was a user that had stopped using Resource, but then began to use it again.
She got responses from a few candidates who had been automatically screened and was forced to speak with candidates that weren’t a good fit, which caused anxiety. She paused her Resource roles and went back to contacting candidates through Linkedin.
Then, she saw a recruiter on her team using a buried feature that allowed her to individually pick the candidates to be contacted: “I saw Sarah clicking approve and asked, ‘what is that’. She explained to me that you can screen each individual candidate in Resource if you change this setting.” She immediately went back to Resource.
Wade heard this same story from a few different customers, so his team made a product change. Automated screening was switched from a default feature to a feature that must be toggled on by the user. Once this switch was made, he saw usage go up and churn decrease across all of his customers.
Although the original feature performed its intended function of reducing work for his customers, it caused anxiety. Wade’s interviews helped him better understand the progress his customers wanted to achieve: “We didn’t think that giving our customers more work in the product would mean them making more progress, but counterintuitively did.”
Revenue
- You’ve already delivered some progress. Find ways to deliver more progress.
- Add features that make progress easier to achieve.
Case Study
When Bryan’s team at TownHound focused their acquisition strategy on dating app users, he started acquiring quality users. He noticed an increase in quality feedback as a result. The feedback he got informed a product update that increased both retention and revenue because it helped to deliver more progress for his users.
TownHound rolled out a new feature that is similar to a feature in the expense reporting app, Expensify. The new feature allowed users to redeem their discounts by snapping a photo of the paper receipt in the app after the meal was over. Before this feature, the user could only redeem a discount by showing a waiter or waitress a confirmation page in the app during the meal.
At its surface, this new feature provides TownHound users more flexibility when redeeming their discounts while at dinner. It could even allow a user to redeem a discount after leaving the restaurant if they forgot to show their waiter the in app coupon.
The new snap-a-photo feature does offer flexibility, but more importantly, it contributes to progress for users who are on dates. Dates are stressful because first, second, and third impressions matter. We want to impress the person sitting across the table. Although most would agree that living frugally where we can is an admirable characteristic, a first date typically isn’t the place to tout this trait. The new snap-a-photo feature allows a TownHound user to redeem their discount without their date knowing. They don’t have to worry about being perceived as cheap!
TownHound is used to help create a meaningful dining experience for users that are looking for a new relationship. Bryan’s team at TownHound had a deep understanding of the progress his customers were hoping to make and the role that TownHound played in delivering that progress. If he had viewed his product simply as a “deals app”, he wouldn’t have been able to make a key product update that brought in more revenue as more users redeemed second, third, and fourth deals.
Referral
- Use incentives that align with progress to influence referrals.
- Don’t assume increased credits, storage, or currency equals progress.
If you help your customers make progress, it’s likely that their friends will hear about your product. Unfortunately, word of mouth alone won’t raise our K Factor above 1, so we must encourage referrals. Social networks like Linkedin and Twitter have had huge wins through productized referrals. Josh Elman explains how his teams at Twitter and Linkedin created winning referral programs in this video called 3 Growth Hacks: The Secrets To Driving Massive User Growth:
Linkedin and Twitter are social networks, so the “better with friends” referral play works incredibly well. What about products that aren’t social? How do we build an effective referral program for customers?
The common referral incentive we see looks like this: “If you use my referral code when you sign up, we each get $10 off our purchase.” Sometimes the reward for the referrer is delayed until the new user makes a purchase, but there is usually a give and a get incentive. In other words, “I give you $10, I get $10.”
Case Study
Le Tote used the standard give/get strategy early on, but couldn’t find the right mix of give/get secret sauce in order for their referral program to take off. Le Tote is not a social product.
Before working as Director of Growth at Le Tote, Luke Langon implemented referral programs at Lyft and two other mobile apps that he co-founded. Luke interviewed his customers in order to find out what give/get incentive would work best. His goal was to increase the percentage of users participating in referrals.
He learned that many of his customers weren’t referring friends because their give of $25 only covered half the cost of their friend’s Le Tote box. This means that their friend would still have to pay in order to test drive Le Tote. His customers didn’t like the idea of recommending a new product that forced their friends to pay. The get of $15 was intended to incentivize a referral, but not all customers were motivated by saving money on their next Le Tote box.
Le Tote’s referral program became a top acquisition channel when it shifted from ‘Give $25/Get $15’, to ‘Give a free box, Get nothing.’ Referrals achieved the lowest Cost Per Acquisition compared to all other acquisition channels and ranked second in volume of new subscribers.
Le Tote’s subscription does help customers save money on new clothes, but this isn’t how they make progress. Le Tote’s customers make progress by feeling confident during important occasions involving people they want to maintain or create a healthy relationship with. This progress is more important than saving money, which is why the old referral program didn’t work for many customers.
How to start using progress to benefit you and your customers
Customer interviews will help you discover what progress means to your customers. Remember, progress is overcoming an emotional struggle to make one’s life better. You need to uncover an emotional hurdle that has nothing to do with your product. When you use progress as your guide, you will create more wins throughout the entire customer lifecycle.
If you’re interested in learning more about Jobs To Be Done, JTBD.info is a great place to start. It’s run by Alan Klement, who’s book I linked at the beginning of this article.
If you have any questions or thoughts, please comment below or feel free to reach out!
About the Author: Chris Brophy likes to drive growth for consumer-focused startups. He’s currently consulting startups on growth strategy at Tradecraft and exploring his next adventure. If you’d like to chat about growth, JTBD, or live music, reach him at cabrophy89[at]gmail[dot]com.

source
https://blog.kissmetrics.com/customers-dont-care-about-your-product/
 When CNN picked up Casey Neistat’s Beme back in November of last year, it announced that the social video sharing app would go the way of the dodo by the end of January 2017. Now here we sit, mere hours away from the second month of the year, and lo and behold, the app is shutting down today. Those who got in on the action during Beme’s relatively short run as a standalone will… Read More
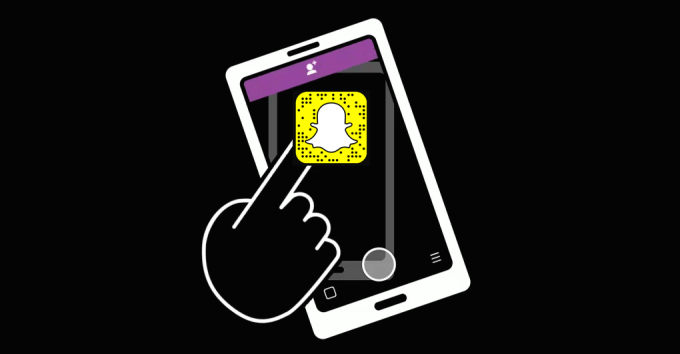 Facebook gave businesses the Like button connected to their Page, and now Snapchat is giving websites their own QR Snapcodes. With today’s iOS update and Android beta, users can create a unique Snapcode for a website, which will open inside Snapchat when they scan it with the app’s camera. This could create a powerful way for businesses and other sites to promote themselves…
 Facebook today announced a laundry list of updates regarding its measurement partnership program, including expanded partnerships with Nielsen and comScore, and the addition of a new partner, DoubleVerify. The company also offered details on the status of current integrations, and the launch of a new online portal to help marketers see how their Facebook ads perform, in comparison with…
  Club Penguin may be shutting down, but there’s a new social network for kids arriving today from LEGO. The company known for its physical blocks and building sets is launching LEGO Life, a safe, online space where kids can share their LEGO creations, and connect with a broader community. Available as an iOS and Android application, the social network is aimed at those under the age of…
  Good enough and convenient. That’s proved a winning strategy for Instagram’s clone, according to a dozen analytics providers, social media celebrities, and talent managers who told TechCrunch they’ve seen a decline in Snapchat Stories usage since Instagram Stories launched on August 2nd.
  Snap, the parent of Snapchat, will be listing on the New York Stock Exchange, TechCrunch has confirmed. The news was first reported by the Wall Street Journal. This means that you can expect to see a big Snapchat banner on Wall Street and that executives will likely be ringing the opening bell when the company debuts, likely in March. The move sends the message that Snap wants its IPO to…
  Snap — the makers of Snapchat — had confidentially filed for its IPO late last year, but it looks like we’ll be getting a look at the inner guts of the company’s financials and workings as early as late next week. The company will file publicly for its initial public offering late next week, according to a new report from Kara Swisher over at Recode. This is yet…
  While other tech leaders glad-hand with The Donald, Mark Zuckerberg is facing him head on. Today the Facebook CEO called out the President for his unamerican views that demonize immigrants, while also tactfully encouraging the few positive policies and comments Trump has offered on the subject. You should read Zuckerberg’s full Facebook post on the topic embedded at the bottom of this…
  The rogue government Twitter account, AltUSNatParkService, which claimed it was being run by current park rangers, says it has now handed off control of its Twitter account to “several activists and journalists who believe they can continue in the same spirit.” The move has led some to question if the account was, in fact, ever operated by disgruntled government employees in the…
 Dating app Hinge recently pivoted from swiping to “stories,” in order to help people find real relationships. That focus on authenticity, however, seems to stand in contrast to a project the company has been testing: Audrey, a personal assistant who will message your matches for you and schedule your dates. Audrey’s existence was first spotted by Business Insider, which…