
Your bounce rate can be such a scary number, right?
It’s common knowledge that a high bounce rate is bad, and a low rate is good.
Every time you log into your Google Analytics account, it’s right there waiting for you.
I understand the feeling when you see that number creeping up.
But the problem is that numbers can be misleading.
After all, how high is too high, really?
In this post, I’ll show you how to fully measure and assess your bounce rate. That way, you’ll know if it’s actually too high for your industry or if it’s perfectly normal.
I’ll share tips and tricks on how to audit your bounce rate and understand what’s driving it up.
I’ll also tell you some of my secrets for lowering your bounce rate.
But first, let’s talk about exactly what a bounce rate is and why you should care.
What is a Bounce Rate and Why Does it Matter?
A “bounce” occurs when someone visits your website and leaves without interacting further with your site. Your bounce rate shows you the percentage of your visitors who bounce off of your site.
By default, Google Analytics considers a visitor to have interacted with your site if they visited at least one additional page.
The bounce rate you see in your overview report on Google Analytics is your site-wide bounce rate.
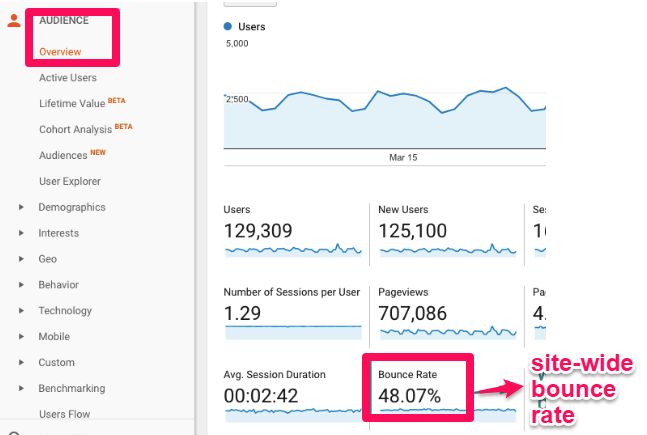
It’s the average number of bounces across all of your pages divided by the total number of visits across all of those pages within the same period.
You can also track the bounce rate of a single page or a segment or section of your site.
I’ll show you how once we start looking at the different segment reports.
The bounce rate of a single page is exactly what it sounds like. It’s the total number of bounces divided by the total number of visits on a page.
Inspired by common questions that we’ve heard, this infographic provides answers to the most asked questions about bounce rate and provides tips to help you improve your bounce rate.

If you run an e-commerce site with a blog, you may want to implement a segmented bounce rate.
Why?
Your blog posts may have a very different average bounce rate than your product pages.
We’ll get into the exact details later, but segmenting the two can make your numbers more meaningful when you’re looking at the data.
So, why is bounce rate important?
According to SEMrush, bounce rate is the 4th most important ranking factor on SERPs.
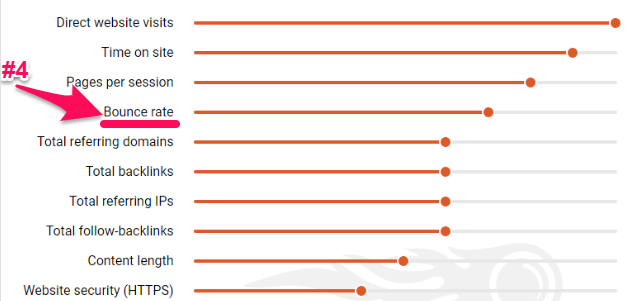
However, Google does not use bounce rate in its algorithm metrics, according to Google’s Gary Illyes:
We don’t use *anything* from Google analytics in the “algo”.
— Gary 鯨理/경리 Illyes (@methode) June 26, 2017
Can they both be right?
Yes, and I’ll tell you why.
Google’s algorithm may not directly take bounce rate into account, but what it signifies is very important to it.
As of 2016, RankBrain was the third-most important ranking factor of Google’s algorithm.
If you’re not familiar with RankBrain, its main purpose is to improve users’ search results by better understanding their search intent.
If a user clicks on your page and leaves without any interaction, that could signal to RankBrain that your site isn’t what they’re looking for.
It makes it look like your result doesn’t match the searcher intent well. As a result, RankBrain says, “Maybe this page shouldn’t be so high in the results.”
Can you see how these connect?
If you understand bounce rate properly, it can tell you if your marketing strategy is effective and if your visitors are engaging with your content.
The key is to understand what your “target” is and break down your bounce rate in a way that provides meaning.
What is a Good Bounce Rate?
Many different variables determine what a “good” bounce rate is.
Things like your business type, industry, country, and the types of devices your visitors are using all influence what a good average bounce rate would be for your site.
For instance, Brafton found that the average bounce rate is 58.18%. However, their research shows that bounce rates are higher for B2B businesses than B2C businesses.
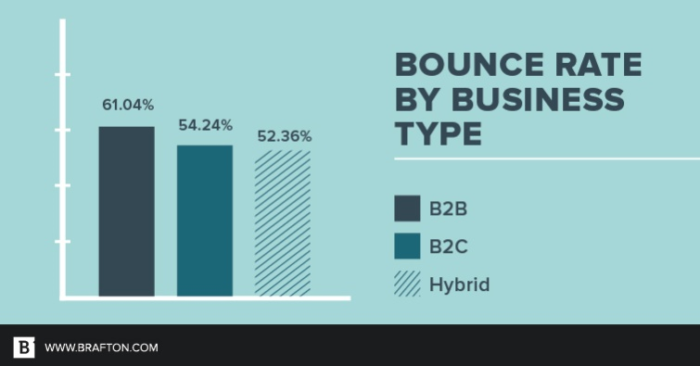
These benchmarks show a wide range of average bounce rates across industries:
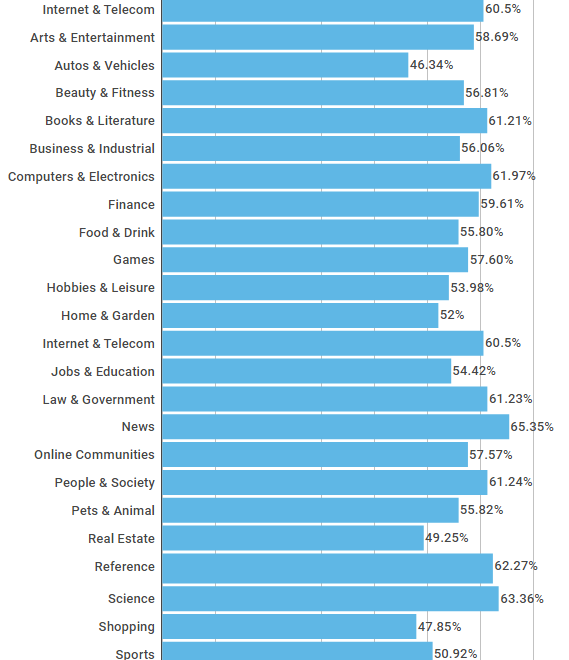
If you’re still unsure about the bounce rate you should be targeting, Google Analytics can help you figure it out.
Google Analytics provides a quick visualization of the average bounce rate for what it believes is your industry. It does this by benchmarking.
First, you need to set up benchmarking in Google Analytics.
Under the admin section, click on “Account Settings” and then check the “Benchmarking” box.
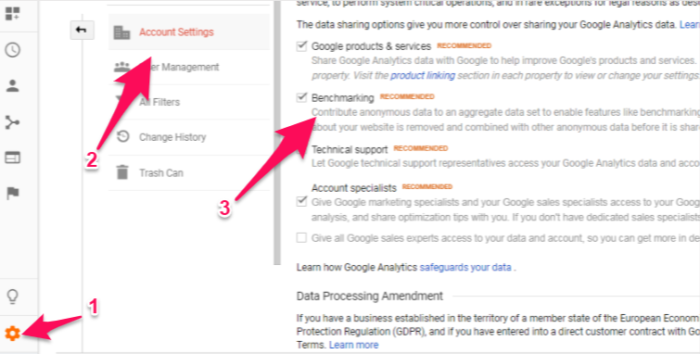
Now you can compare industry averages.
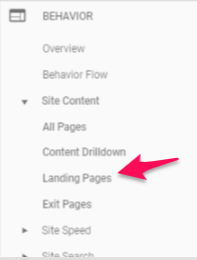
Just navigate to your behavior reports. Click on “Site Content” and then “Landing Pages.”
You’ll immediately see the average, site-wide bounce rate.
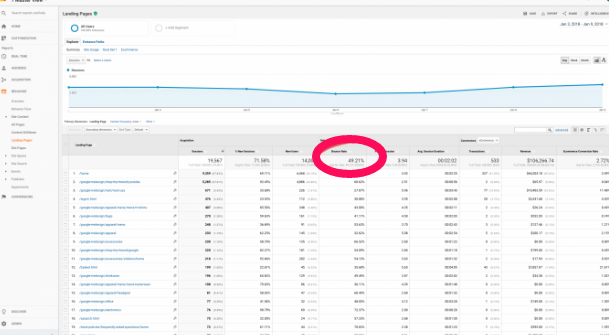
Of course, a site-wide average can be too broad to be a valuable benchmark.
You can drill down further to view section-specific bounce rates.
With either the Content Drilldown Report or the advanced filter feature, you can see the average bounce rates for your site sections.
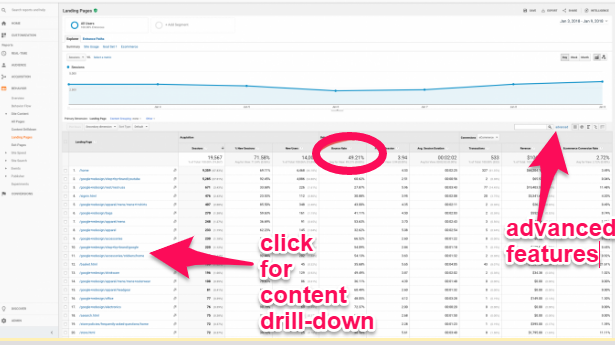
For example, now you can compare the industry average for just your blog or product pages.
In the “Audience” section of Google Analytics, go under “Behavior” then “Benchmarking.” Then, select “Channels.”
Now you can choose your vertical and compare whichever time period you want to review.
This should give you a better idea of your website’s bounce rate performance compared to the average by channel.

The chart above compares your channel bounce rate against other Google Analytics accounts or properties in your industry.
If you want to look deeper, you can do so by going into “Acquisition,” then “All Traffic,” and then “Channels.”
Then click the “Comparison” button on the right and filter by “Bounce Rate” to see which channels are above or below average.

You can then dig even deeper into each one for further analysis.
Ultimately, a “good” bounce rate will be different for every site. It may even be different for every page on your site.
I suggest you focus on your bounce rate trends over time and how you can improve the highest ones to boost conversions.
The focus should be on using this metric to find weaknesses in your site. Don’t worry about hitting a magic number.
Now, let’s look at how you can improve your bounce rates.
Modifying Bounce Rates
Your site-wide bounce rate is too broad to be anything but a vanity metric.
It’s too shallow to provide meaning.
To measure and assess your bounce rate, you need to narrow it down and group it by different variables.
You won’t be able to start lowering your bounce rate until you really understand what’s causing it to be high.
You can modify the bounce rate metric you see in Google Analytics in a couple of ways.
As I already mentioned above, the first way is by segmenting your bounce rate.
We’ll look at nine different segment options that will help you assess and improve your bounce rate.
Segment Bounce Rate by Age
There are plenty of different demographics that Google Analytics tracks, which allows you to better segment and analyze your site traffic.
One of these is the age range of your visitors.
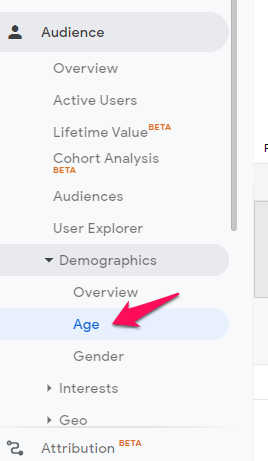
To look at bounce rate by age range, look under “Audience” and then “Demographics” on the left-hand sidebar. Then, click the “Age” option.
 .
.
The resulting report should look something like this.
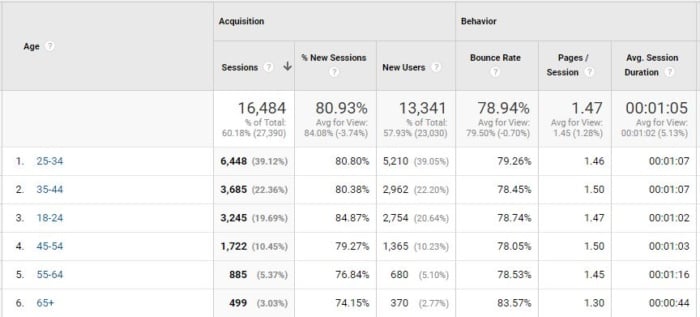
Now you can easily see if your bounce rate is higher with a certain age range.
You can see in the example above that seniors (65+) have a much higher bounce rate than the rest of this site’s visitors.
If seniors are part of your ideal target market, make sure that you structure your web pages properly for marketing to them.
For example, avoid using jargon, trendy language, and slang.
Segment Bounce Rate by Gender
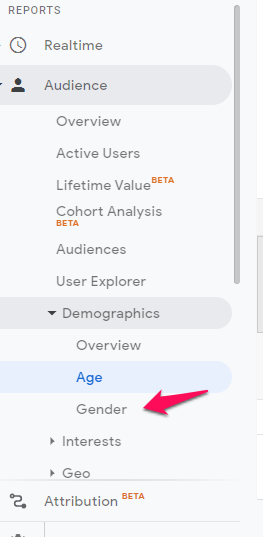
The “Gender” option is just below “Age” on that left-hand menu.
This report tells you your bounce rate for males and females.

You can now easily see if your site is better at retaining one gender over the other.
Gender targeting with tactics such as different language and colors can impact viewing and purchasing behavior.
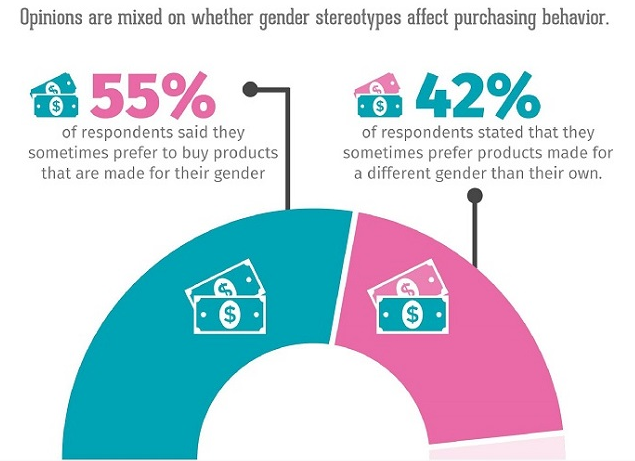
If you have a higher bounce rate with one gender, make sure you’re not accidentally creating the perception that you’re only targeting the other sex.
Segment Bounce Rate by Affinity
The next option in the “Audience” section is under “Interests” and then “Affinity Categories.”
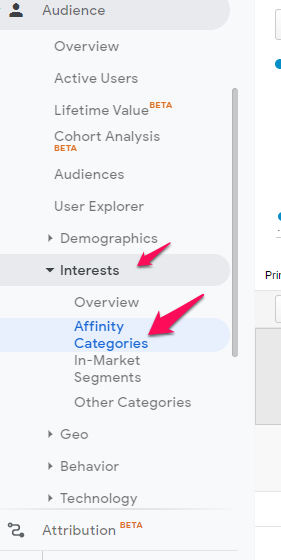
This groups bounce rate based on visitor interests.
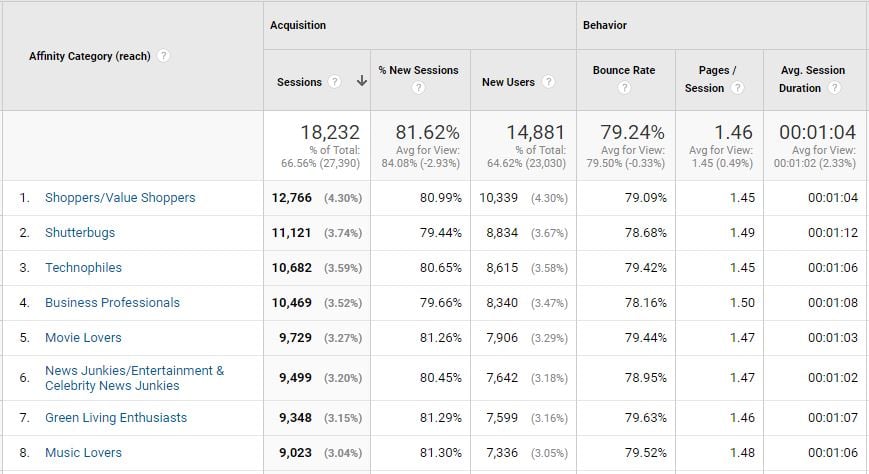
Check out which affinity categories have the highest bounce rates to see if you’re losing out on key marketing groups.
You can see in the example above that this site is engaging best with business professionals and shutterbugs.
Engagement with music lovers, movie lovers, and green living enthusiasts is the poorest.
This knowledge can now help you better target those groups with your imagery and content.
Segment Bounce Rate by Location
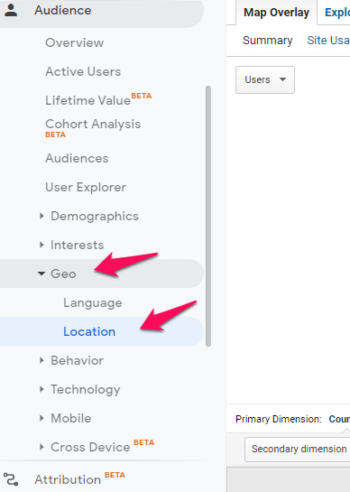
Still in “Audience,” just under “Interests,” you’ll find the “Geo” section. Within that, you can click on “Location” for another segment report.
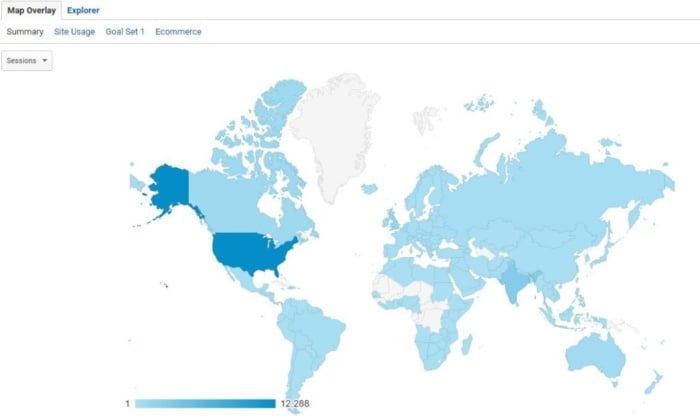
First, you’ll see a color-coded map that shows you where most of your visitors come from.
Below that, you’ll see the table version breaking down your visitors by geographic region.
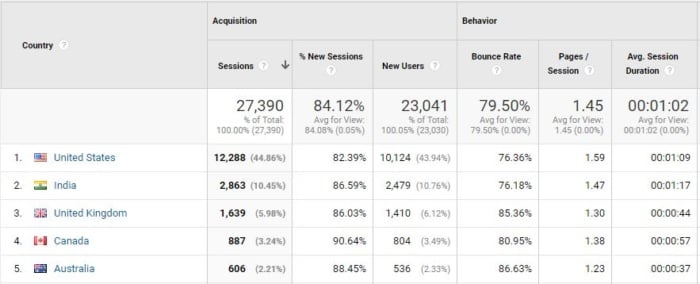
This gives you your bounce rate by country.
In the example above, you can see that Australia and the UK have much higher bounce rates than the other countries.
You can drill further into it to see if certain provinces are engaging worse than others. Then, you can adapt your marketing strategy to target areas where you want to see improvement.
Segment Bounce Rate for New Visitors
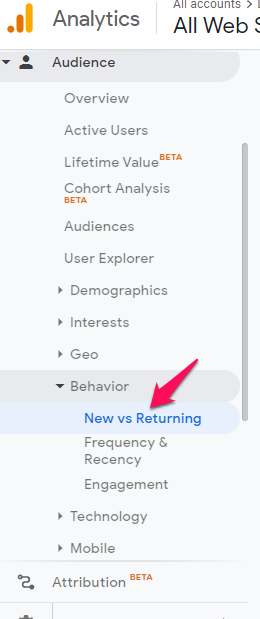
A good segment to check out is the “New Vs. Returning” breakdown. It’s also in the “Audience” section under “Behavior.”
No comments:
Post a Comment