Consulting data is good.
But being a slave to data, is not.
There is such a thing as being too data-obsessed. Confirmation bias pops up. And you miss the good, albeit, intangible stuff that comes along with your efforts.
The solution is to uncover those biases and misunderstandings that lead you astray.
It’s not easy. Or even intuitive. But it’s the only way to avoid these five analytics blinders.
Here’s how it strikes when you least expect it.
Here’s why you fall for it.
And here’s how to avoid it by bringing in other types of feedback and analysis.
Lie #1. Your “conversions” are flawless
You’ve got three AdWords campaigns.

- The first brings in zero leads on $78 bucks spent.
- The second brings in one at a cost of $135.31.
- The third brings in two at $143.28 per lead.
Nine times out of ten, the campaign with more “conversions” is declared the winner.
But what do you really, truly, know about this scenario?
Which campaign is actually performing the best? Which is putting the most money back into your pocket?
There’s simply no way to tell at this point.
First and foremost, these “conversions” are leads — not closed customers.
Second, they might be for different products or services. So different average order values or LTVs come into play.
Third, this is nowhere close to statistical significance. For example, the third campaign has the most leads because you’ve spent the most money on it.
Not because it’s “better.”
What if you simply spend the same amount on the first two? What if you let them both get to around the same ~$150/per mark?
See what I mean?
Too many “what ifs” for my taste.
Yet this is exactly what happens inside any marketing department. The same end result pops up after each client or superior meeting.
Everyone points to the third campaign. It gets the adulation. It gets the increased budget. It gets the additional staff and resources.
So it becomes a self-fulfilling prophecy.
One solution to figure all this out is closed loop analysis.
Ideally, your goal is to match up the customer’s information (name, email, phone, credit card) to the lead data you’re seeing inside Google Analytics.
Haha — just kidding.
That would mean you were gathering Personally Identifiable Information, which is a big no-no in Google Analytics.
Do it and they’ll delete your account right away.
The simplest alternative is to just use a tool that gives you this power, without jeopardizing your data. Hint, hint.
Lie #2. Your “top” traffic sources
What are your top sources of traffic?
A quick glance inside Google Analytics usually tells you (1) organic search and (2) direct. Maybe a little (3) referrals thrown in for good measure if you got some press last month.
Here’s the problem.
Two of those three are legit. The other is not.
The problem is that your direct traffic isn’t, in reality, all that “direct.”
Technically, this should be the number of people typing in your website URL to the address bar and hitting “Enter.”
Instead, it’s a healthy mix of email, social media, and good ol’ organic search.
The bigger the site, the bigger this problem usually is.
For example, The Atlantic couldn’t account for or explain how 25% of their visitors came to their site.
One of the biggest publishers in the world. One of the most respected. Who gets paid based on the number of visitors and page views they get. Has no idea how a quarter of their traffic is getting to their site.
That ain’t good.
But how can you really tell where people are coming from, if most analytics programs can’t tell you with any degree of accuracy?
For instance, let’s say your new, fantastic-looking email campaign is about to go out.
It’s been given the green light. “Legal” gives you the A-OK.
But wait! You didn’t tag the promo links correctly.
Now, you’ve spent all that time on a campaign that won’t have anything to show for it, because the traffic you get will now end up in the dumpster pile officially known as “Direct traffic.”
This isn’t just an email. It affects each and every social message, press mention, and blog post referral, too.
It can even affect your organic search traffic.
Groupon found this out the hard way. Literally. By completely de-indexing themselves for a few hours.

What did those crazy couponers find? That nearly 60% of their direct traffic was actually coming from organic search.
Sixty-freaking-percent.
But don’t freak out just yet. There are solutions here.
First, you can use Google’s UTM builder to make sure you are properly tagging your links. This means any and everything you have control over.
Manually tag them before they head out the door, or copy & paste into a lightweight app like Terminus.
If you’ve got long, cumbersome URL, you can be pretty sure that any traffic to that page didn’t come from Direct traffic.
People aren’t going to remember it. Which means they aren’t going to just spontaneously type it in.
Instead, these peeps probably came from another place, like an organic search or email.
However, in the same breath, you can probably consider homepage traffic to be legitimate Direct.
So create a segment based on these URLs and traffic sources to pinpoint “Dark Traffic” in its tracks. And prevent it from ruining your data in the future.
Lie #3. Top of the funnel performance = results
Yes, we want traffic.
Yes, we want pageviews.
They make us feel all warm and fuzzy and proud. Like our hard work isn’t going unnoticed.
But they should not be the end-all, be-all.
Use them to see how you’re doing over last month. But don’t misunderstand numbers to be the Holy Grail, either.
Like this, for instance:
Looking at only this, you walk away feeling like a boss for all the numbers you’ve racked up. Seriously, I can’t even count that high.
But what about when you consider the bounce and exit rates for each of those pages? Are people staying? No? Color you embarrassed.

Are you still so excited by your thousands of pageviews if most of them left immediately?
Bounce rates are real. And you’ve gotta consider them when you are looking at your metrics.
They mean that people haven’t had the chance to interact with your soft micro conversions. They haven’t had a chance to activate.
So take a look at the big picture.
Are your blog posts and site pulling people in, but not making them stay?
This isn’t a horrible problem to have, because it’s a problem you can pinpoint.
The traffic is there. They just don’t really like what they are seeing once they get to your site. Which you can fix.
First, set up some events to get a better idea of what’s happening on your pages. Then, make sure you have actionable goals that will allow for movement you can track.
Or use the Kissmetrics’ Customer Engagement Automation tool to analyze what people are actually doing on your site and with your products. Then, you can interact with behavior-based messaging to keep them around longer. Or keep them coming back for more.
That way, you can increase conversions, engagement, and retention without the guesswork.
Just always remember that numbers don’t tell the whole story. Use them with a grain of salt and a little bit of context.
Lie #4. Deceptive A/B “wins”
I’m just going to be honest with you. Those A/B testing “wins” you just got? Don’t always have the best track record.
I’m sorry to be so harsh right off the bat. Sometimes the truth hurts.
What’s even more worrisome? Oftentimes, tests will look like they have succeeded. But that’s not always the case (or at least, not the whole picture).
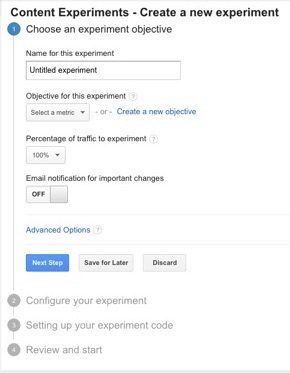
Start with Google Analytics content experiments, instead.
You can use it to contrast your varying pages to see if there are any sizeable adjustments that cause positive changes.
Instead, it allows you to compare different page variations to see which ‘bigger’ changes result in improvements. Maybe this works a little better because it adds an extra letter– it’s an A/B/N test.

The problem with this test is when you get a little too grab-happy.
You can quickly and easily remove fields to get better results, for instance. A simple reduction of three fields will increase your conversions by 11%.
Or, you can take away specific conversion-busters like the need to add a credit card for a non-paying trial. Sure, this will up your “conversions.”
But remember how far that got you a few lies ago?
That credit card field you took away? It was a huge indicator for which of your customers will eventually buy. 50% of people who put in their credit card will end up converting. While only 15% will of those who don’t enter a credit card will.
And we’re talkin’, conversions-conversions here. Like, bottom-of-the-funnel, paying customer conversions.
Context is key when you are looking at analytics.
Don’t test landing pages or simple changes to fields while only evaluating the top of the funnel. Make sure you dig in to see how the changes affect the rest of the customer experience and journey.
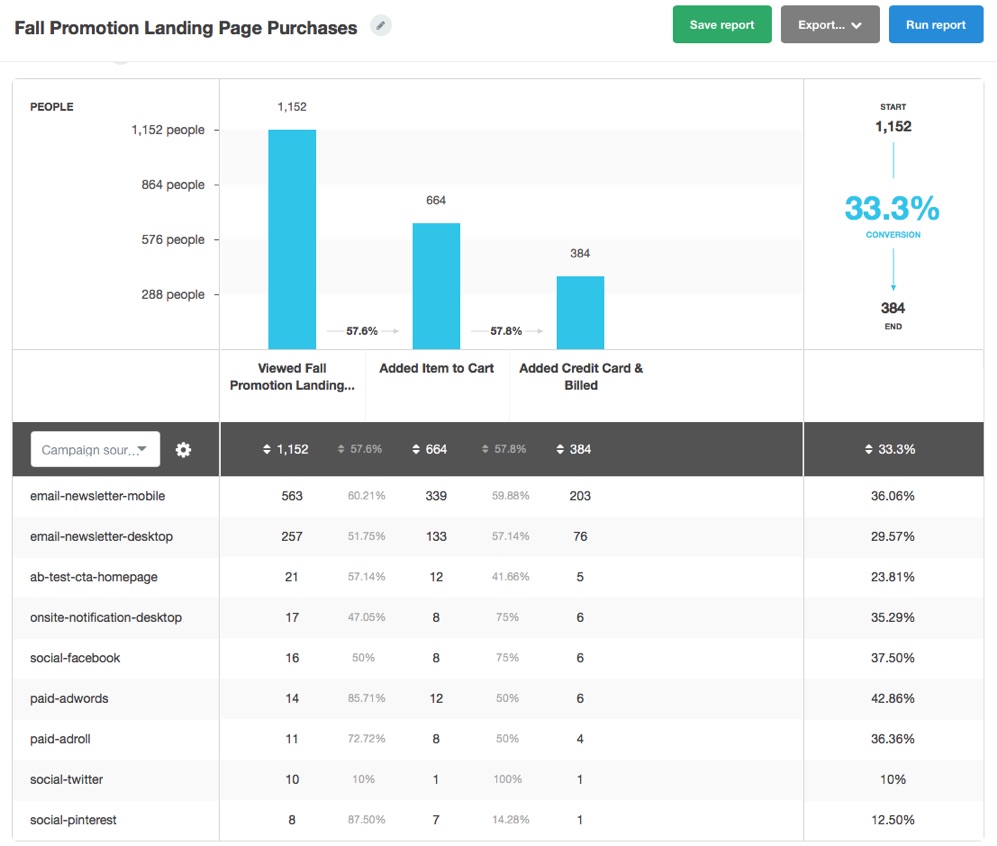
To do that, use the Funnel Report so you can see exactly how top-of-the-funnel changes are impacting bottom-of-the-funnel sales.
Lie #5. Your channel source attribution
A Forrester Research study years ago found that 33% of all transactions of all transactions happened after new customers had gone through more than one touchpoint.
That number jumps to 48% when considering repeat customers.
The same report showed that paid search is the highest source of conversions.
Is it, though?
Or is it just the last point most commonly used before a sale?
Just because it’s the last one, doesn’t mean it’s the only one.
What other marketing tactics are working to increase growth? Forrester went on to declare that while email works for repeat conversions, social media brings in less than 1% of sales.
Ok. Then how do you explain SpearmintLOVE?
You know, the freaking baby blog that boosted their revenue by 991% in year using Facebook and Instagram.
The only reason I know about them? Because my wife has bought clothes from them. After discovering them on Facebook and Instagram.
One, simple Google graph puts this myth to bed. Fast.
If you look at the left side, or “assist interactions,” you’ll see that social channels will put new products in front of people.
As you move toward the middle, customers get more information about products and options using search. At the end, they’re on their way to the website.
Notice all the possible interaction options here. It’s not just the last-touch that brought the customer to the website. They can take many steps to get there.
Google Analytics has a few different attribution options built-in to help you change how conversions are assigned.


No comments:
Post a Comment